

Creating a compact city
Australian academics have established that the built environment significantly impacts wellbeing. How do we create urban centres that maximise health? Simon Vincett investigates.
Sprawling is a descriptor rarely employed in a positive sense, and it certainly hasn’t got a good connotation when applied to cities.
A series of papers published in September 2016 in the renowned medical journal The Lancet, have established, by multiple measures, that poor health results from our spreading suburbs. Led by Australian academics, the three papers in a series called ‘Urban design, transport and health’ explore the nexus of transport and land use as a key determinant of population health.
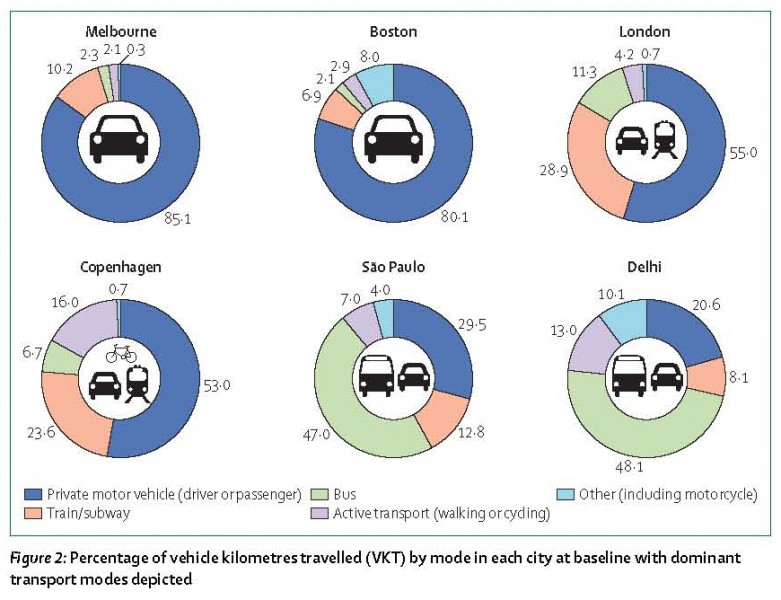
By comparing modelled scenarios of varied land use and transport provision in six different cities – Melbourne, London, Boston, Copenhagen, Sao Paulo and Delhi – the study was able to measure the impact of our current urban development that locates residences far remote from workplaces and leaves people reliant on private motor vehicles for transit.
 It’s not just Melbourne that stands out as an Australian city with girth issues. Currently over 70% of Australians live in cities and by 2050 the populations of Australia’s four largest cities are predicted to be similar to Australia’s current total population.
The lead author of the second paper, “Land use, transport and population health”, is Professor Mark Stevenson from Melbourne University.
“Sprawling residential-only developments that dominate most suburban areas in North America, Australia, and New Zealand limit the ability of people to walk or cycle for their daily travel requirements,” Stevenson told Ride On.
“In these countries, low-density housing developments make public transport development cost prohibitive, producing a reliance on private motorised transport and increasing exposure to the risks associated with traffic speed, traffic volume, vehicle emissions and physical inactivity.”
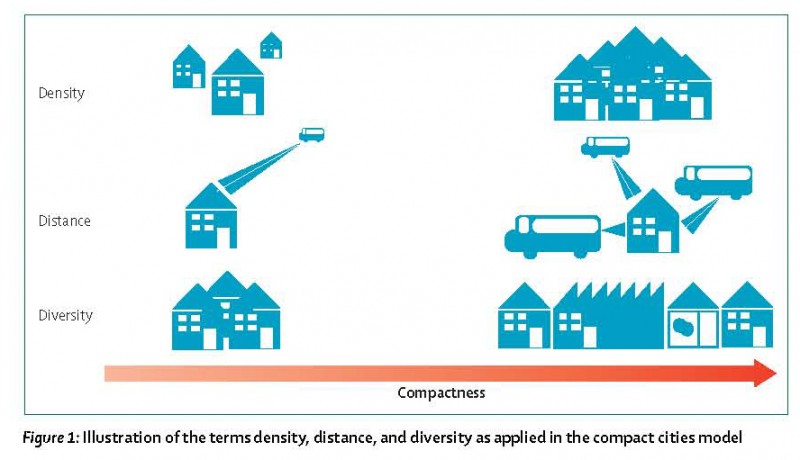
The alternative, the paper suggests, is a compact city: “Considerable health gains are observed by city planning that encourages a compact city – namely, a city of short distances that promotes increased residential density, mixed land use, proximate and enhanced public transport, and an urban form that encourages cycling and walking.”
The paper levels the responsibility for making the change to a compact city squarely at government: “The findings we report here suggest that government policies need to actively pursue land-use planning and urban design interventions that encourage a modal shift toward walking, cycling, and low-emissions public transport to influence the overall health of growing city populations.”
 Australia is finding its way with federal leadership on urban development, which has always been a matter for state and local governments. At only certain times in the intensive urbanisation of Australia since World War II has the obvious need for an overarching vision prompted national government involvement.
In 1972 Gough Whitlam founded the Department of Urban and Regional Development but it was abolished by the Fraser Government in 1975. Then the Hawke Government, at the urging of a Special Premier’s Conference in 1991, developed a Building Better Cities Program to improve urban development processes and the quality of urban life by coordinating various levels of government.
Most recently, the Rudd Government, with Transport Minister Anthony Albanese, released a National Urban Policy in 2011, which establishes for the first time the Australian government’s overarching goals for the nation’s cities and how to make them more productive and sustainable.
Malcolm Turnbull’s current Government was the first to create an Australian federal ministry for cities. Ride On spoke to the first federal Minister for Cities and the Built Environment, Jamie Briggs, about the portfolio, but it was early days and very little policy had been developed. After just two months in the role, Briggs resigned following a scandal and the portfolio was put on the back burner within the Department of Prime Minister and Cabinet.
Upon winning the Prime Ministership in his own right in 2016, Malcolm Turnbull re-organised, creating an Assistant Minister for Cities and Digital Transformation, handing that portfolio to the Hon. Angus Taylor MP, and a Minister for Urban Development, with the Hon. Paul Fletcher in that role. Both of these are outer ministries with no seat in the cabinet and a senior Minister to answer to: the Prime Minister for Angus Taylor and the Minister for Infrastructure and Transport, the Hon. Darren Chester MP, for Paul Fletcher.
Ride On approached Minister Fletcher but had no response from his office. While he has also not long been in the role, a survey of his speeches and media releases suggests Minister Fletcher – a former telco director – is most interested in technology as an aid to current infrastructure, with applications such as driverless cars. There is nothing to suggest he grasps the issues or has an appetite for the large-scale re-zoning and densification of our cities that our population-health demands.
The health impact of land use and transport is a challenging issue for the traditional portfolios of government.
“It requires very much a trans-disciplinary approach and complex systems thinking to deliver the solution,” explains Stevenson. “I think of this as a 21st century dilemma really, because clearly there needs to be integration across a number of the portfolios. But it’s something you see not only in Australia but also in many jurisdictions where that is really challenged.”
The scale of change to be undertaken is also a challenge to timeframes of the current political cycle.
“We have a governance structure that is short term,” points out Stevenson, “in that we have three-year cycles, and what seems to get lost every time is the investment in our infrastructure.”
Stevenson has a vision of the models he has helped to develop providing the tools to enable government to make sound decisions quickly.
“I’m looking at ways that we might be able to develop a decision platform for 21st century cities. Some of the work we’re doing here in the Melbourne School of Design is creating … virtual cities that allow us to … look at what might happen … around moving much more into active transport. It can give us solutions that are rapid and insights that are more valuable than what we’ve been operating with previously.”
All of this planning and policy making needs to be evidence-based, utilising good data. But is measurement of active transport well measured?
“A prime example of that is the recent census,” suggests Stevenson, pointing out that commutes involving more than one mode are not accurately recorded. “It’s valuable having a census to get a cross-sectional view of how are people moving around our cities but no option allows me to provide that detail. When I answer that question, I say I walked to my public transport system, I got off my public transport and I walked again.”
“Similarly if you cycled and linked to public transport, both modes aren’t captured. So no, we don’t have a good picture on that. However, that does vary between states. I know for example that NSW do capture that mix of walking, cycling and public transport, because they specifically ask questions about it in one of their transport surveys.”
For an overview of what the census has revealed about bike riding over the years with some commentary, have a look at Bicycle Network’s reporting of the statistics since 2006. http://bit.ly/2fd3wYI
Evidence-based planning is a foundation tenet for Bicycle Network, which is why it has coordinated the Super Tuesday and Super Sunday bike counts since 2007, and before these, conducted annual bike counts in Melbourne from 1992. Super Tuesday positions volunteer counters at key intersections during the morning peak hour to record rider numbers and movements. This is conducted on the same day in multiple locations in up to 94 councils across Australia. Super Sunday is the version of the count for recreational riders. It takes place on a Sunday over a longer period on selected off-road paths.
The data from the Super counts generates a map showing flows of bike riders through their journeys and provides data for the local council areas to use for their transport planning. Along with the census and some other data collections, the Super counts also provide ‘big data’ to inform planners and policy makers.
As a visual count, the Bicycle Network Super counts are able to record the gender of riders. This is important because, to borrow a phrase from ecology, women are considered an ‘indicator species’ of the viability of bike riding in a particular place or on particular infrastructure. Basically, if women are happy to ride there, then the perceived risk is low, the conditions for bike riding are good and you could expect rider numbers to grow.
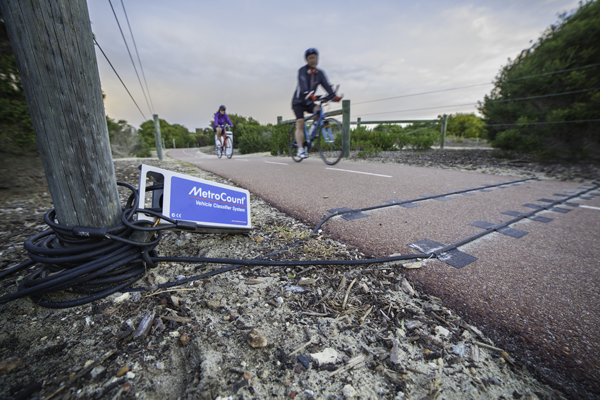
Another vital tool for data collection of bike riding are automatic counters installed permanently or temporarily on bike routes. For instance, the state road authority VicRoads has over 40 permanent counters across the Melbourne shared path network that has recorded bike traffic since 2011. These record 24 hours a day, seven days a week, and capture the direction of riders as well as their speed.
MetroCount, the manufacturer of these counters, is based where the company began, in Fremantle, but nowadays it sells its hardware, software and expertise in 110 countries. Maurice Berger of MetroCount points out that a great strength of the fixed counters are that they establish riding trends, which he argues are as important as the actual numbers. “Where the two-hour count has an issue I believe is when people might use it to look at changes over a period of time, this year versus last year for instance. Any city where it might happen to rain on that particular day will have effected numbers. Let’s not make any decisions based on that beyond knowing that when it rains fewer people cycle.”
 So who wants the ‘big data’ and what are they using it for?
“From the state government point of view they tend to be the ones who are responsible for the asset – the bike network,” says Berger. “So they’re wanting to monitor the usage to ensure they’re getting value for their investment. When you get down into the local government area they’re looking at specific issues such as ‘Are we allowing our constituents to move from A to B? Therefore, are we linking up the bike paths? Do we have good enough bike paths to allow kids to ride to school or people to go to the shops or wherever they need to go?’
“They also want to know the number of people using their paths so they can get more funding to upgrade the paths and extend the link. Councils are beginning to schedule a rolling program of cyclist counting just like most municipalities have with rolling motor vehicle traffic counts. That’s really exciting from an active transport point of view because we can know where people really are cycling.”
Speed differentials is another important aspect of bike riding infrastructure that only the automatic counters can accurately measure. Berger explains: “Local governments really want to know the speed of the cyclists on the off-road network because of the interaction between pedestrians and cyclists. If they know the speed and they know the volume they’re able to put that across for more funding to reduce that conflict by separating the people on foot from the people on bikes.”
Because, although bike infrastructure is far cheaper than providing for motor vehicles, funding is always an issue and requires a strong case to be made.
“To be able to get more funding for Smart City initiatives for bike networks you need more data and you need good data,” Berger points out. “The last five years has seen good growth in traffic monitoring for that reason and certainly bike monitoring.”
The good news is that the interest in adequately providing for bikes looks set to increase. “Traffic planning is moving already to hold [motor vehicles] as the least prioritised form of transport,” Berger asserts.
But “more and more data is needed” says Berger. “This is a developing science. Bicycle Network has been very strong in looking at providing an analytical basis for this that removes too much subjectivity. We’re still in the early stages of getting a good understanding of when to switch over from low volume to high volume, and low speed to high speed when separating pedestrians from cyclists. Because most people involved in this come from a traffic engineering background and they are looking at it from a traffic modelling point of view which can lead to wrong assumptions.”
So this is where we need our professionals and academics to analyse the data and design and implement the transport system for the future we want. But first comes the data and Professor Mark Stevenson, for one, would like more of it.
“We hovered over the top of the cities. We had macro-level data to begin to explore the relationships but really, in order for us to have some really concrete answers and directions, we’re going to need to leverage the big data,” he says.
Bicycle Network’s Super counts play a valuable part, says Stevenson: “Any of that sort of data is quite valuable to be able to extrapolate from.”
“Beginning to capture exposure for cyclists is pretty limited. That whole area needs to be explored significantly. We need to get a better picture of where people are cycling, how different the infrastructure is that they’re cycling on, and how to better design the infrastructure for safe journeys and to enhance our active transport commute.”
Volunteer as a counter for Super Tuesday or Super Sunday
Ride On content is editorially independent, but is supported financially by members of Bicycle Network. If you enjoy our articles and want to support the future publication of high-quality content, please consider helping out by becoming a member.


Very interesting article. Is it possible that you could post the full citation for the Lancet series – I’d like to have a proper read myself. Cheers.
Thanks for the prompt Ben, we should have included that link from the outset. It’s linked now.